Thailand-s-Decarbonization-Journey-1995-2024
🌏 Thailand’s Decarbonization Journey (1995-2024)
A data-driven deep dive into ASEAN’s energy transition.
Tech Stack: SQL (Window Functions) | Power BI | Sustainability Engineering
📑 Table of Contents
- Project Abstract
- Introduction & Motivation
- Data Infrastructure
- Exploratory Data Analysis
- Strategic Insights & Discussion
- Recommendations & Action Plan
- Expected Outcomes
- Conclusion
1. Project Abstract
This analysis summarizes CO₂ emission trends over a 29-year period (1995–2024) to evaluate Thailand’s progress toward its 2065 Net Zero target (Ref: Thailand’s LT-LEDS). By benchmarking national data against regional peers—Indonesia and Vietnam—this work identifies the key factors and structural challenges involved in the transition to cleaner energy sources.
2. Introduction & Motivation
The primary goal is to examine the relationship between economic growth and environmental impact. The analysis focuses on Thailand’s Energy Mix and its long-term reliance on fossil fuels. By processing three decades of historical data, this study transforms statistical metrics into a clear overview of the country’s current energy trajectory and future outlook.
3. Data Infrastructure
A structured pipeline ensures data integrity and a “Single Source of Truth”:
Workflow: [Data Source] → [SQL] → [Power BI] → [Strategic Roadmap]
- Source: Global CO₂ Emissions Dataset (1950–2024) curated by Luca Lullo via Kaggle, originally sourced from Our World in Data (OWID).
- SQL: Data cleaning, regional filtering (TH, ID, VN), and YoY calculations.
- Power BI: Interactive dashboards for trend analysis and strategic insights.
- Domain Expertise: Sustainability Engineering principles for data validation.
4. Exploratory Data Analysis
Pillar 1: The ASEAN Showdown (CO₂ per Capita)
Comparison of carbon intensity between regional peers to evaluate “Carbon Fairness” relative to population size.
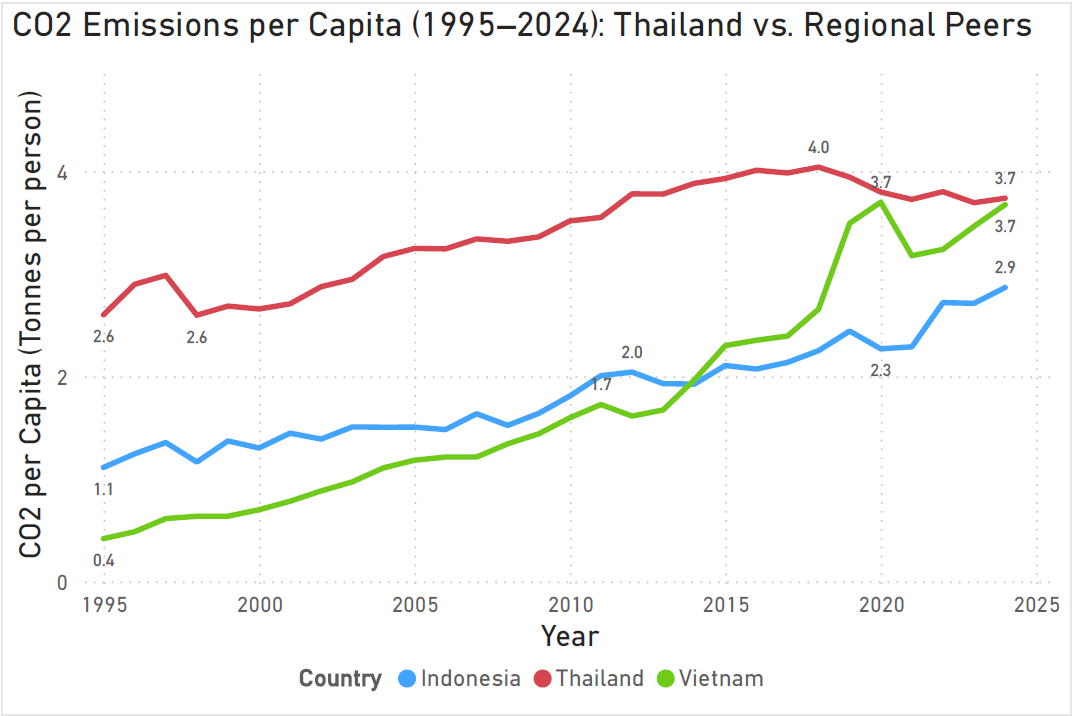
Key Insight: Thailand maintains a consistently higher emission rate per person compared to Vietnam, highlighting a more carbon-intensive energy infrastructure.
Pillar 2: Thailand’s Energy Mix (1995–2024)
An analysis of fuel source distribution over three decades, identifying the core dependencies within Thailand’s power sector.
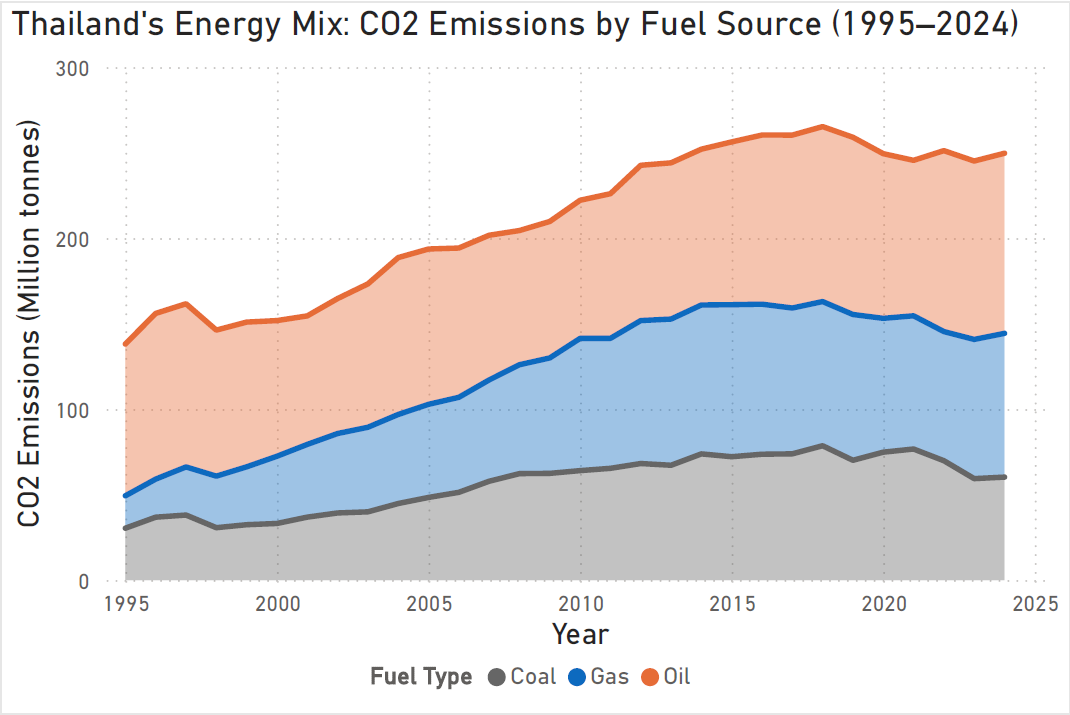
Key Insight: Fossil fuels remain the dominant energy source, with a heavy reliance on Natural Gas. While Renewables show growth, the pace is currently insufficient to meet the aggressive 2065 Net Zero timeline.
Pillar 3: Fossil Fuel Persistence vs. Renewable Growth
A direct comparison between traditional energy reliance and the expansion of clean energy initiatives.
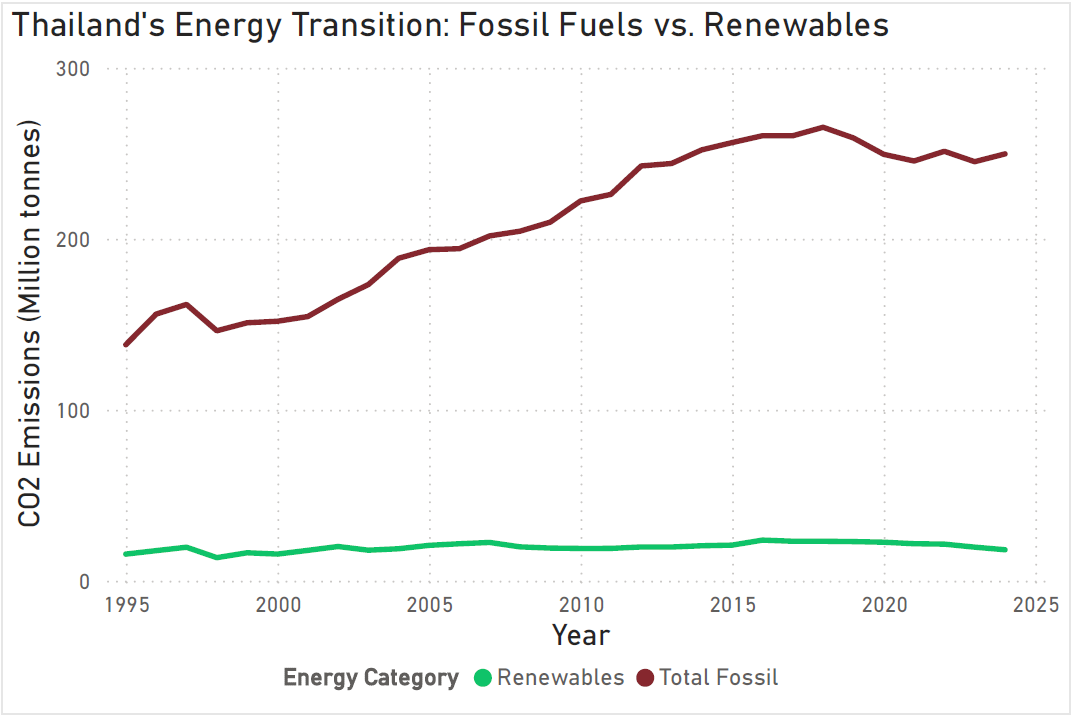
Key Insight: Despite increasing investment in solar and wind, the sheer scale of fossil fuel consumption continues to create a “Carbon Lock-in” effect (Ref: Environmental Economics Framework) that complicates the rapid transition.
Pillar 4: Economic Growth vs. Emission Intensity
This pillar examines the “Decoupling” effect—determining whether Thailand can grow its GDP without a proportional increase in CO₂ emissions.
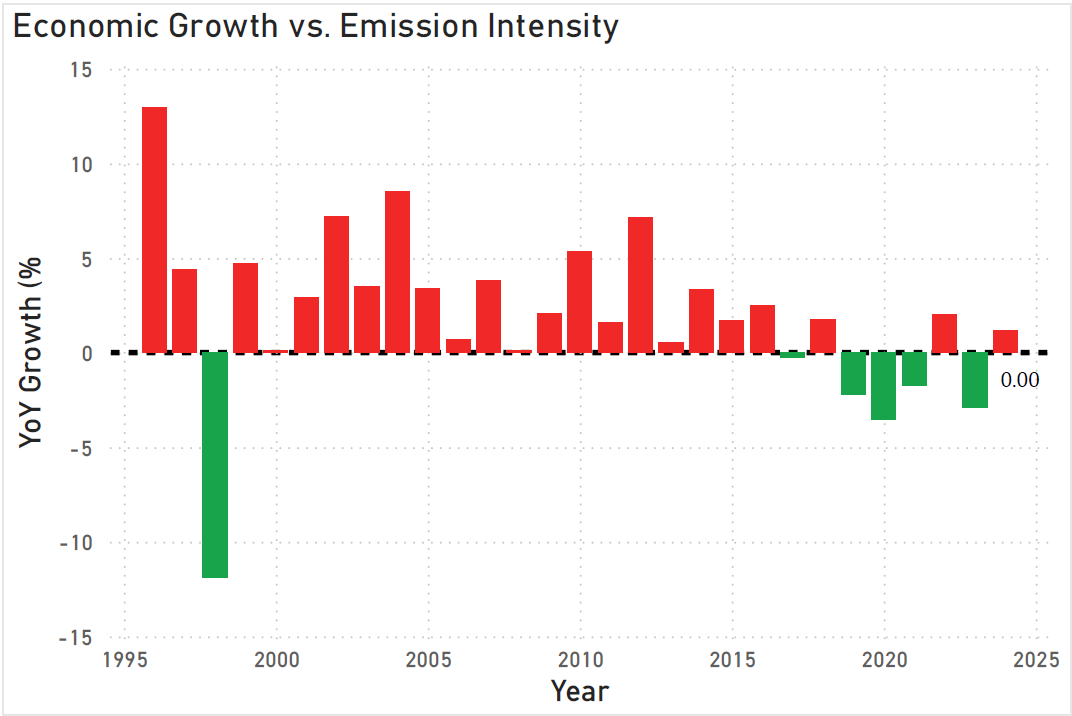
Key Insight: While Thailand shows signs of relative decoupling, the correlation remains strong. Achieving absolute decoupling requires a more aggressive shift in industrial efficiency and low-carbon investment.
5. Strategic Insights & Discussion
To prepare the dataset for visualization, Window Functions were utilized to calculate year-over-year (YoY) growth and regional rankings directly within the SQL layer.
/* Calculating Year-over-Year (YoY) Growth for CO2 Emissions using Window Functions (LAG) */

WITH CarbonData AS (
    SELECT
        country,
        year,
        co2,
        -- Fetch previous year's CO2 value
        LAG(co2) OVER (PARTITION BY country ORDER BY year) AS prev_year_co2
    FROM co2_emission_1950_2024
    WHERE country IN ('Thailand', 'Indonesia', 'Vietnam')
)
SELECT
    country,
    year,
    co2,
    -- Calculation: ((Current - Previous) / Previous) * 100
    ROUND(((co2 - prev_year_co2) / NULLIF(prev_year_co2, 0)) * 100, 2) AS yoy_growth_percent
FROM CarbonData
WHERE year BETWEEN 1995 AND 2024;
Key Insight: Handling data logic at the SQL level ensures high performance in Power BI, allowing for seamless filtering across three decades of historical data.
6. Recommendations & Action Plan
Based on the data trends, three strategic pillars are essential for Thailand to bridge the gap toward Net Zero 2065:
- Accelerating Renewable Integration: Beyond solar and wind, focus must shift toward Grid Modernization and energy storage to manage the intermittency of clean energy.
- Enhancing Energy Efficiency: Decoupling GDP from emissions requires deep-tier industrial efficiency upgrades and a shift toward a circular economy model.
- Policy & Carbon Pricing: Implementing carbon taxation or trading schemes will be the “Final Boss” in disincentivizing fossil fuel reliance and attracting low-carbon investment.
| Strategy | Action Plan | Expected Impact |
|---|---|---|
| Grid Modernization | Implement Smart Grid & ESS (Energy Storage) | Reduce intermittency of Renewables |
| Industrial Efficiency | Deploy AI-driven energy monitoring systems | Absolute decoupling of GDP and Emissions |
| Carbon Market | Finalize Thailand’s Emission Trading System (ETS) | Accelerate low-carbon investment |
7. Expected Outcomes
- Data-Driven Policy Support: Providing a clear baseline for carbon reduction targets.
- Public Awareness: Visualizing the urgency of the energy transition for stakeholders.
- Methodological Framework: A scalable SQL-to-Power BI pipeline for ESG reporting.
8. Conclusion
Thailand stands at a critical crossroads. While the transition to a low-carbon economy is underway, the data suggests that current efforts must be doubled to meet the 2065 Net Zero commitment. This analysis serves as both a progress report and a call to action for systemic change in our energy infrastructure.
📚 References & Data Sources
- Lullo, L. (2024). Global CO₂ Emissions (1950-2024) via Kaggle.
- Our World in Data. CO₂ and GHG Emissions Database. Source.
- Official Policy. Thailand’s Long-term Low GHG Emission Development Strategy (LT-LEDS).